With the recent announcement about the General Availability of Azure Spring Cloud and Public Preview of Steeltoe.NET on Azure Spring Cloud, Microsoft and VMWare have enabled enterprises to utilize a single solution for both Java and .NET applications.
One of the topics in the GA announcement that caught my eye was the mention of Distributed Tracing with Azure Spring Cloud and Azure Application Insights.
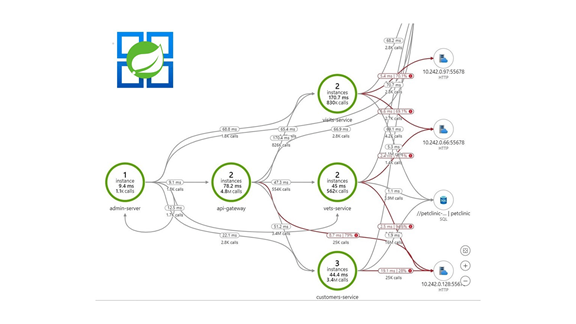
Distributed Tracing with Azure Spring Cloud and Azure Application Insights
Quote from Microsoft Announcement:
“The diagram above captures microservice transactions in Application Insights for 4 hours with 70 percent sampling rate. We purposely dropped one of the microservices, to showcase services that are operating correctly (green) and those with bottlenecks (red).”
Having worked through numerous production issues throughout my career, the topic of Observability has always fascinated me. So, when I saw the above diagram in the announcement, I wanted to try it and write about my experience.
Azure Setup
Before the services can be deployed, the Azure Subscription has to be set up with the necessary infrastructure. The rest of this article is written with the assumption that a valid subscription already exists. I have used Azure CLI and Azure Portal interchangeably in this article. The deployment of a micro-service to Azure Spring Cloud can be performed only using Azure CLI. So, install the latest versions of CLI and the spring-cloud extension.
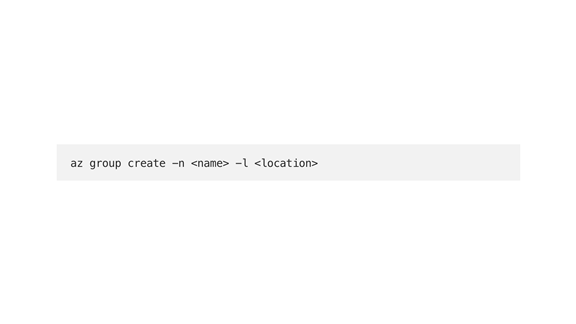
If there are no existing Resource Groups, start by creating a new Resource Group. Login to Azure CLI and run:
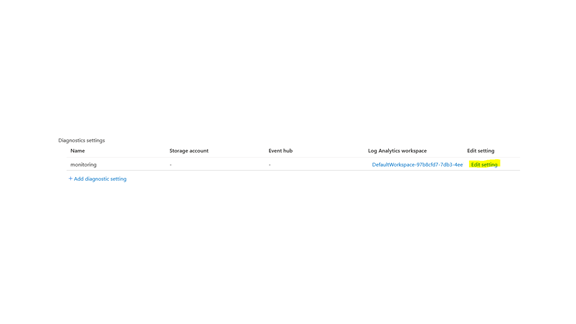
Creation of the Azure Spring Cloud provides some extra defaults, such as the creation and association of a default Log Analytics workspace and Application Insights. In addition to this, a “Diagnostics settings” to send the Application Logs to this workspace is also created by default.
Login to the Azure Portal, search for Azure Spring Cloud and click Create. There are 2 plans, Basic and Standard. Select Basic for Dev/Test.
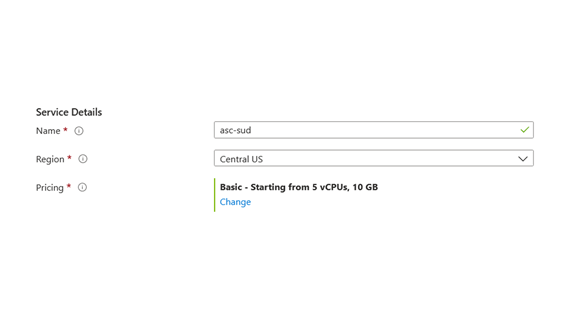
Provide the required details and click Next. Even though the Review+Create button is enabled, go through Next to see the defaults provided by Azure.
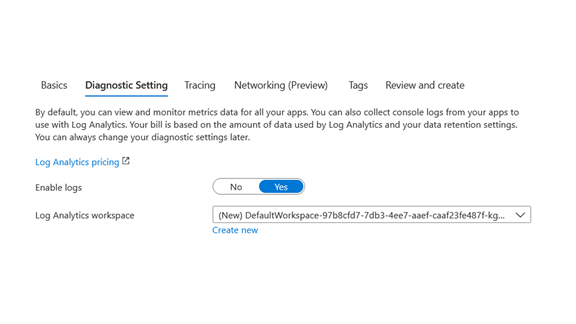
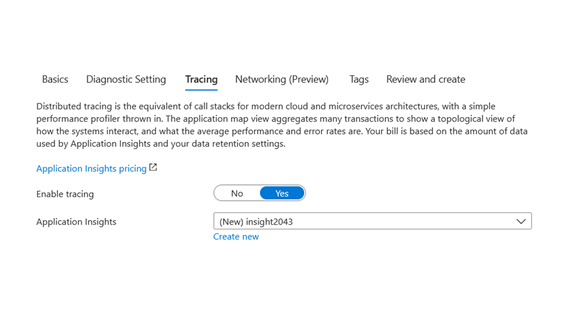
Notice that Log Analytics and Application Insights are configured by default. We will be using Application Insights later. Finally, review and create the plan.
Once the Azure Spring Cloud is created, navigate to it and click on the Apps link from the navigation bar. We have to create applications before the code can be deployed to them.
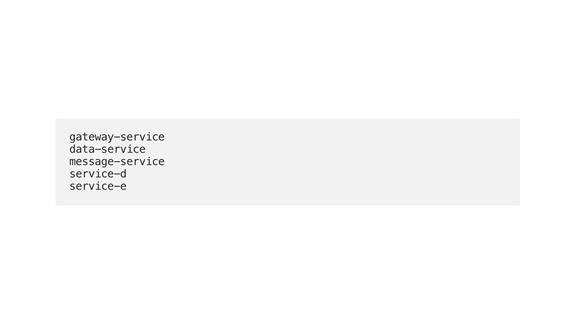
Create the below applications:
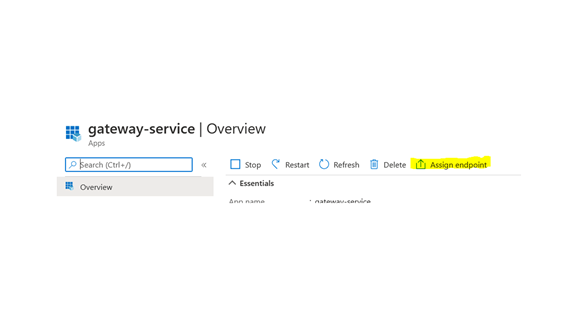
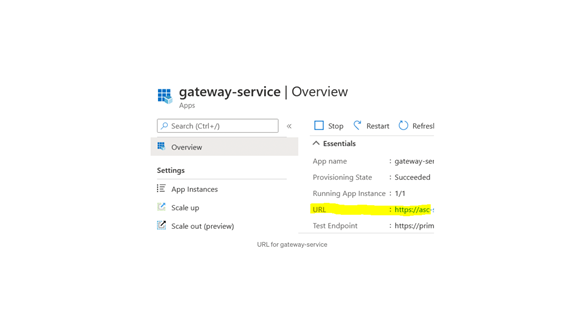
Once the apps are created, assign a public domain for gateway-service.
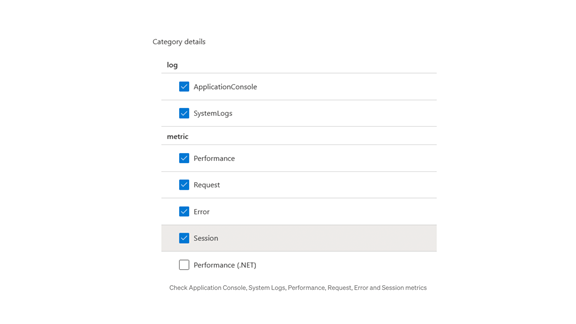
Go to Monitoring from Azure Spring Cloud and click on Edit Settings against the Log Analytics Workspace that was created during Azure Spring Cloud creation. Select all checkboxes that are applicable for Java:
With this, the Azure setup is completed.
Code
Since the purpose of this article is to show the integration between Azure Spring Cloud and Application Insights, all 5 applications are developed with no business logic. One of the services is modified to wait, so that the performance difference between services can be visualised. The final code for them is available in the Github repo.
Build and Deployment
If the Azure Spring Cloud is created with the Standard plan, the source code can be directly deployed. Azure uses Pivotal Build to create a build and execute the deployment. For the Basic plan, the deployment from source is not available.
Since the Basic plan was selected above, build each application. I prefer Gradle, and use the assemble command to create the JAR file.
Navigate to the root of the project in the CLI and execute the command below to deploy the generated JAR to Azure Spring Cloud:
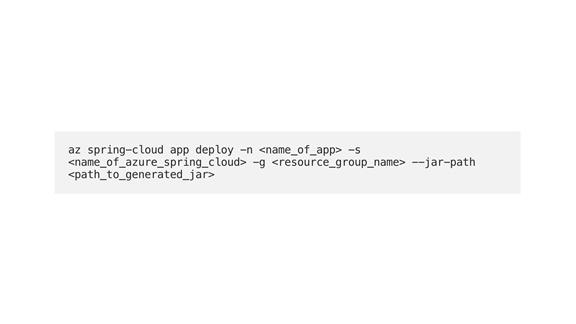
The generated JAR will be present under the target/build folder, depending on the OS. For example, /target/gateway-service-0.0.1-SNAPSHOT.jar
Once all the applications are deployed, verify their status in the Apps section. If all the services are showing as UP, the deployments were successful.
Validation
Access the public URL of gateway-service. This URL can be found in the Overview section of gateway-service.
Access it several times to show some activity. Then open Distributed Tracing from Azure Spring Cloud and click on View application map.
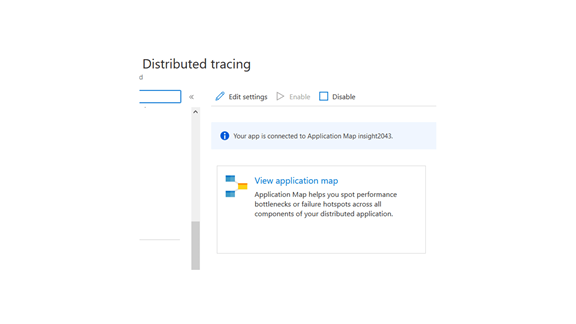
If all of the above setup steps were followed, an image similar to below will appear.
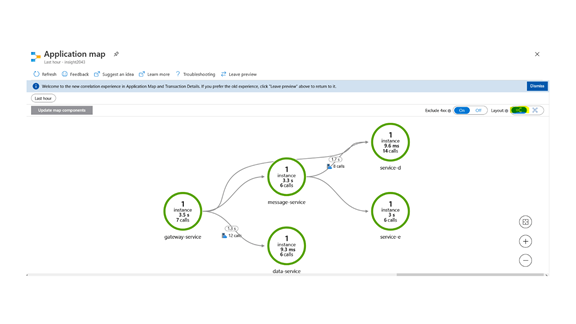
If the dashboard looks different, click on the Hierarchy Layout, as highlighted in the above image.
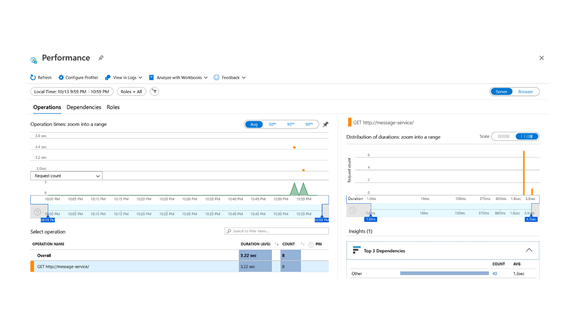
There were no Java Agent deployments and no Azure specific code changes, but the entire trace of calls are available by default in Application Insights. Clicking on a particular application can provide in-depth detail.
Conclusion
Having worked with several APM solutions, the overall setup, installation and code changes for integrating Azure Spring Cloud with Azure Application Insights were trivial, but the end results were great! Getting the full trace view with the ability to drill down for each application was always a challenge, but this integration has made it easy with very minimal setup. The automatic trace collection is limited to certain Azure Services. For example, it is not yet enabled for Azure Cosmos DB. So if an app is connecting to Cosmos DB, the database will not show up on the Application Map.
In future releases, I hope to see more details, such as the call trace including Java method level information, the time taken for each method call and integration with more Azure services such as Cosmos DB, etc.